Neuroimaging Techniques
To study the living brain we need imaging (Fig. 1). Imaging can be used to visualize detailed anatomical structure (structural imaging) as well as determine which brain areas are active during a task (functional imaging).
Structural imaging includes: magnetic resonance imaging (MRI), computed tomography (CT) and positron emission tomography (PET).
Functional imaging includes: electroencephalography (EEG), magnetoencephalography (MEG) and functional MRI (fMRI).
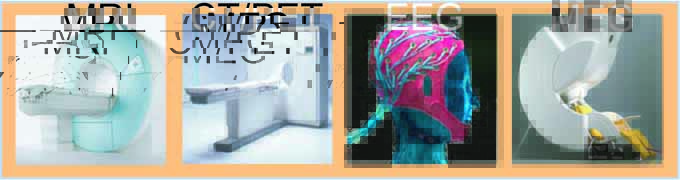
Fig 1: Images of different imaging technologies.
Magnetoencephalography (MEG)
Most of the studies summarized in these pages used magnetoencephalograpy (MEG) and structural MRI.
MEG tells us about brain electrical activity changes that occur on a millisecond timescale (Fig. 2). To do this, MEG uses superconducting quantum interference devices (SQUIDS) which work via magnetic induction.
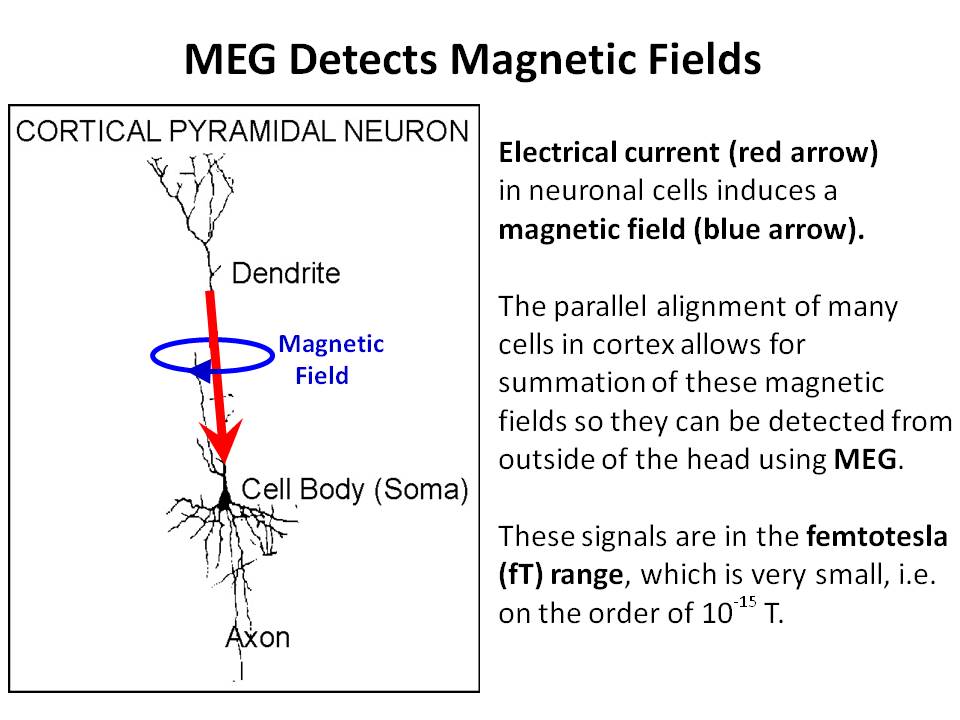
Fig 2: Magnetoencephalography (MEG) can be used to measure brain activity on a millisecond (ms) time scale.
Because the fields generated by the brain are so small, MEG recordings are conducted within a magnetically shielded room which blocks external noise (Fig. 3). When recording, a subject sits in the MEG chair which is then raised so their head is snuggly within the helmet. MEG is a passive recording technology, no external fields/currents are applied and the device simply listens to activity changes in the brain.
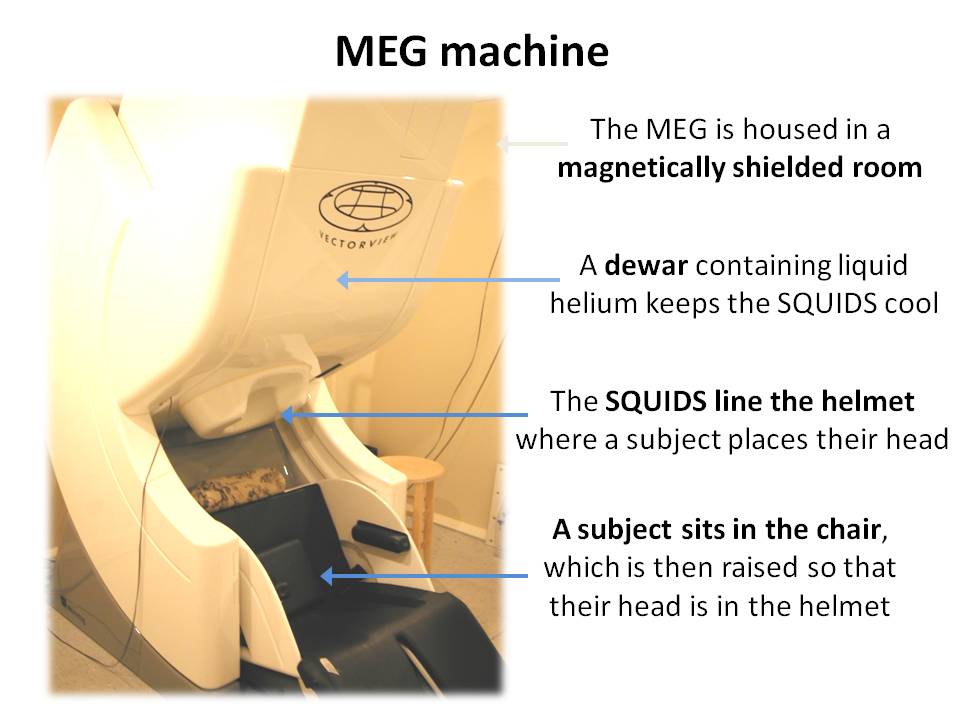
Fig 3: MEG is recorded in a shielded room and uses SQUIDS to detect brain activity.
The studies discussed in these pages combine the temporal resolution of MEG with the spatial resolution of MRI. Specifically, MEG responses are mapped to each subject’s individual MRI.
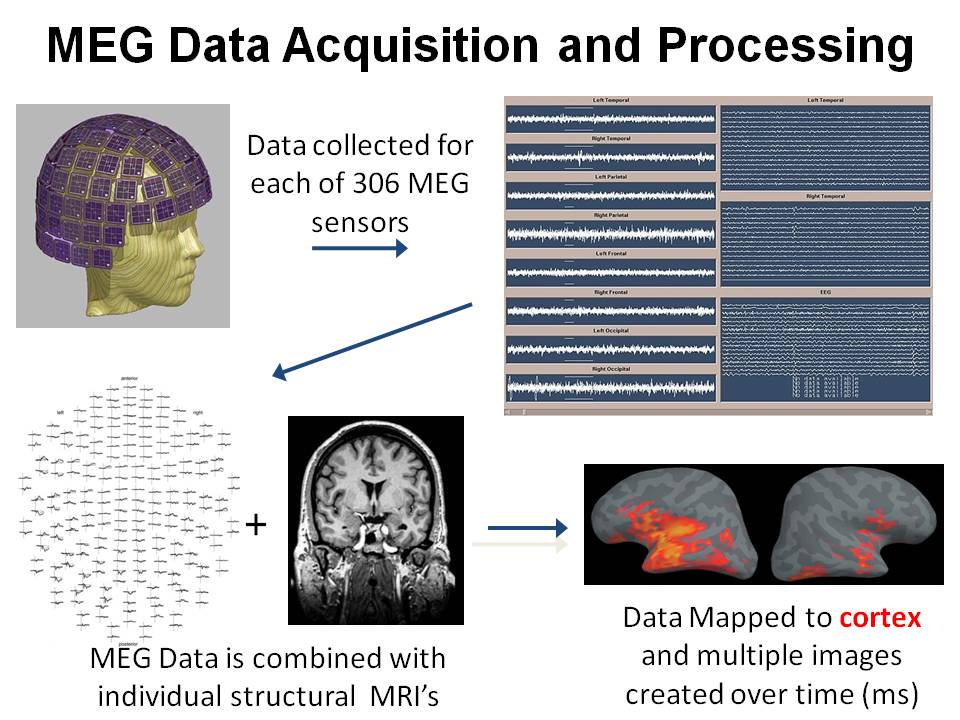
Fig 4: Each subjects MEG response is mapped to their structural MRI. This allows us to simultaneously evaluate the spatial and temporal dynamics of their brain activity.
Brain Oscillatory activity
Although many of the images shown in these pages are event related field (ERF) responses, data may also be evaluated in the spectral domain for changes in oscillatory power. For example, in the image below the top raw signal can be decomposed into it constituent bands and their power assessed.
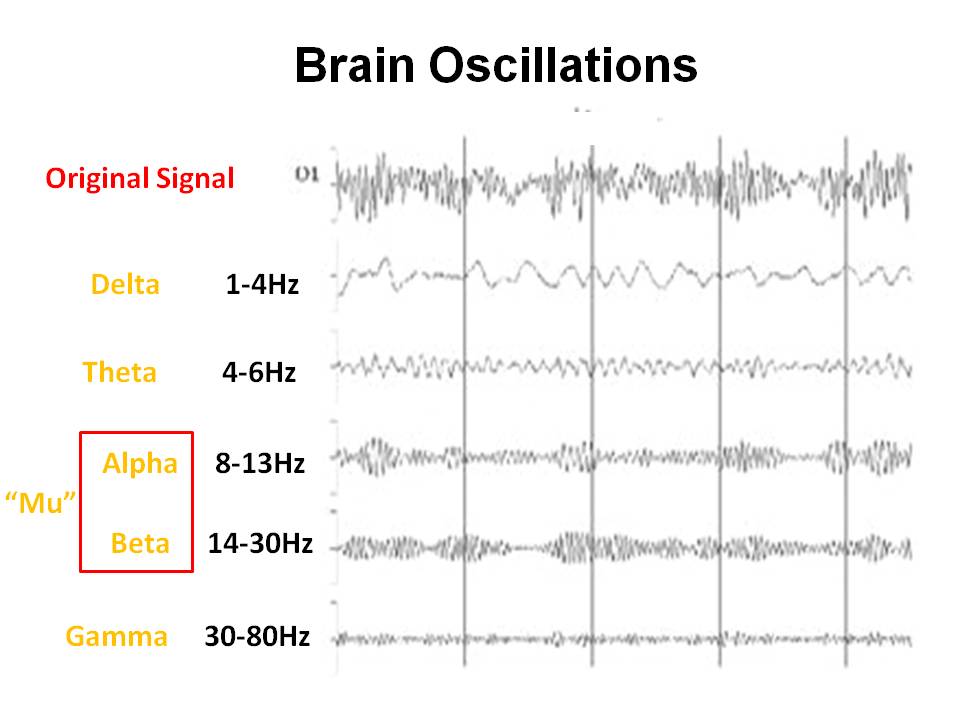
Fig 5: MEG data is often assessed for oscillatory activity. In this picture the top waveform can be decomposed into it constituent frequency bands.