Current Imaging Work
In my current job, I provide operational support for genomic medicine research (see my CV). However, I also assist in the development of quantitative imaging pipelines.
Quantitative Imaging in Lung Cancer
According to the American Cancer Society, there were roughly 234,030 new cases of lung cancer and 154,050 deaths in 2018 alone.
This project involves the development of a pipeline (framework) for the extraction of clinically relevant features from clinical images and reports and their subsequent rendering to a structured format that is amenable to real time query.
Clinical Relevance
It is very import to understand how effective an ongoing treatment plan is. To do this a baseline must first be established and changes over the course of the treatment must be monitored.
This pipeline uses the initial diagnosis “process” for establishing a baseline and repetition of certain steps to evaluate changes (Fig 1):
- Initial consult – patient & physician meet, imaging study is ordered.
- Patient is imaged.
- Radiologist creates a radiology report.
- Ad Hoc analysis, Tumor Board consult & Treatment Recommendation(s).
Steps A through D are repeated for tracking disease progression. The pipeline extracts information from B & C to aid in step D by providing more validated data points.
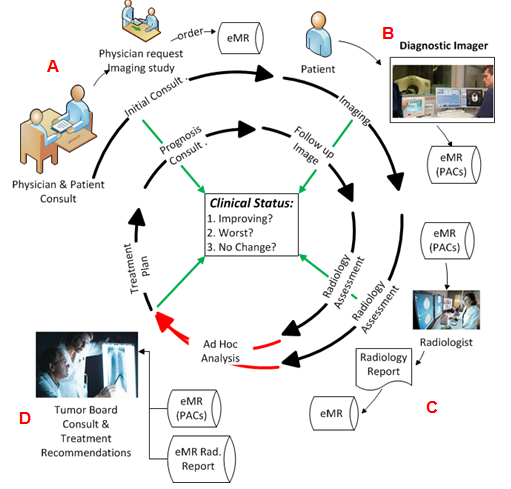
Fig 1: Schematic representation of the current process for assessing a patient’s tumor status: There are 4 inputs (green lines) for determining clinical status (center box); these are consults, imaging, assessments and evaluations.
Brief description of the Pipeline
A modular pipeline (Fig 2) was constructed so that components may be easily updated or replaced. Information is extracted from images and reports using quantitative image processing and natural language processing techniques. Extracted metadata is stored in a database to be made available for later analysis.
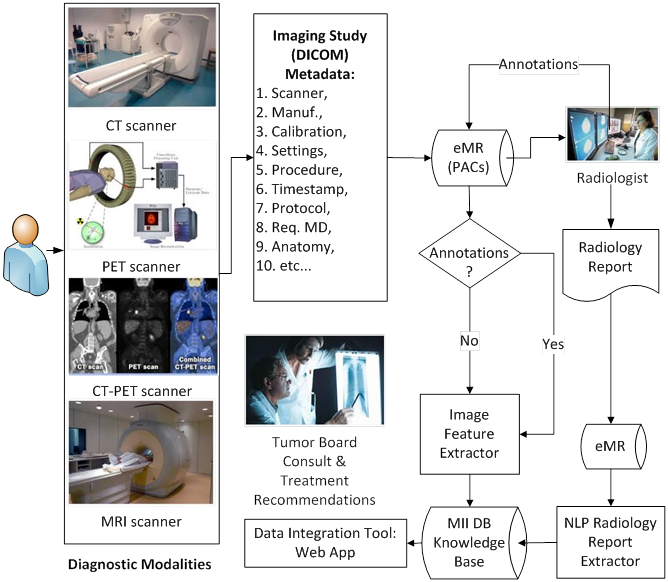
Fig 2: Pipeline Schematic
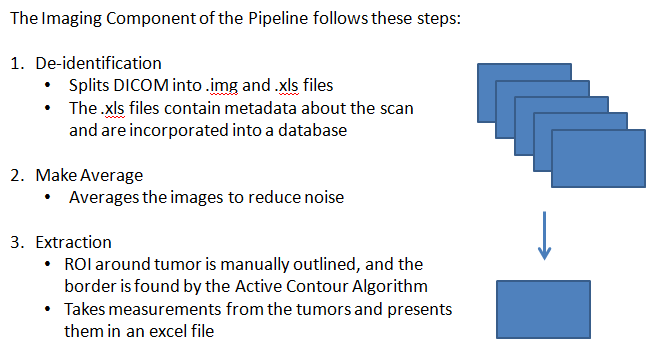
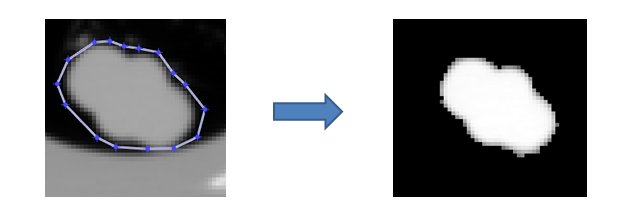
Extraction
To obtain tumor volume, image slices are manually marked. For example, the border with blue dots (Fig 5) shows the ROI manually highlighted while the image on the right is the result of the Active Contour Algorithm, which is used evalualte the tumor borders.
THIS PAGE IS STILL UNDER CONSTRUCTION